Beyond DPI - How LPs Measure Private Equity Performance
DPI shows how much cash a fund has returned, but it doesn’t tell the full story. LPs now look beyond DPI to other metrics for a complete view of performance. These reveal both realised and unrealised value, timing of returns and market comparison.

Private equity (PE) performance has traditionally been measured by Distributions to Paid-In (DPI), the simplest and most straightforward metric to show how much cash has been returned to limited partners (LPs). While DPI is clean, objective and easy to compare across funds, it fails to capture the full picture of performance, particularly in today’s more complex investment landscape.
Exits are becoming more uneven, dry powder (unused capital) is at record highs and valuations are volatile. Relying solely on DPI can be misleading, either giving a false sense of security or undervaluing a fund’s performance. As the market evolves, sophisticated LPs have realized that DPI alone isn’t enough to measure true performance.
The challenges of relying on DPI alone
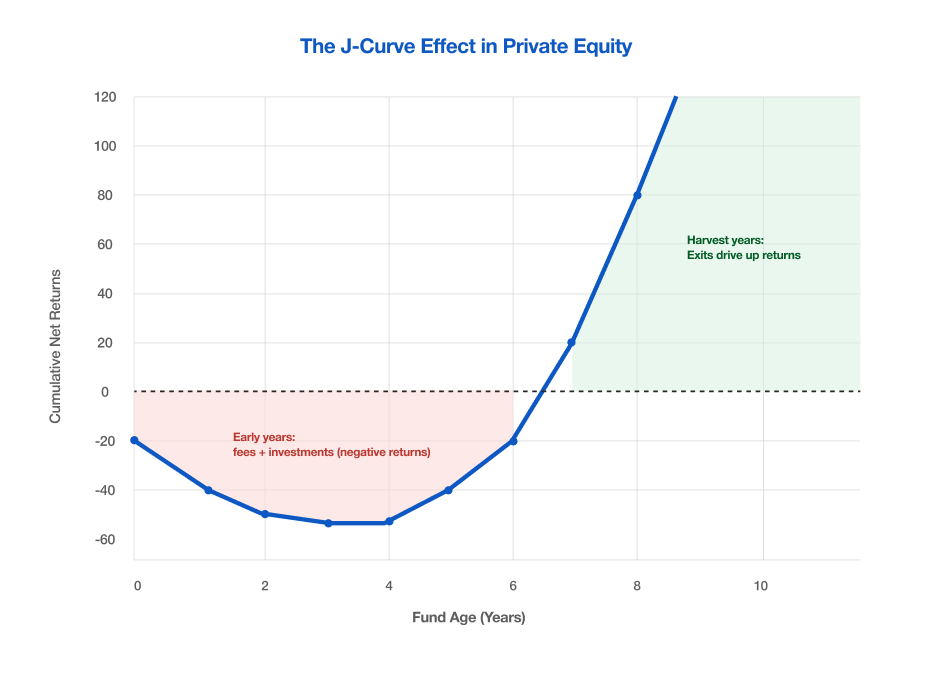
DPI shows the cash that has been returned to investors, but it doesn’t account for how quickly cash flows back or the value that is still unrealized. A high DPI early in a fund’s life can be engineered by selling small stakes or liquidating assets prematurely, sacrificing long-term upside for short-term optics. Similarly, a low DPI during the middle of a venture or growth fund isn’t necessarily a sign of underperformance; it can simply be the result of the natural J-curve effect.
The real challenge is understanding how the timing of returns, the amount still unrealized and the stage of the fund impact DPI. Without considering Total Value to Paid-In (TVPI), Internal Rate of Return (IRR) and the fund’s maturity, LPs can misinterpret performance, overestimating or underestimating a fund's true value.
A holistic approach to measuring performance
To gain a complete view of a fund’s performance, LPs should triangulate DPI with TVPI, IRR and PME (Public Market Equivalent). These metrics offer a fuller understanding of liquidity, scale and future potential.
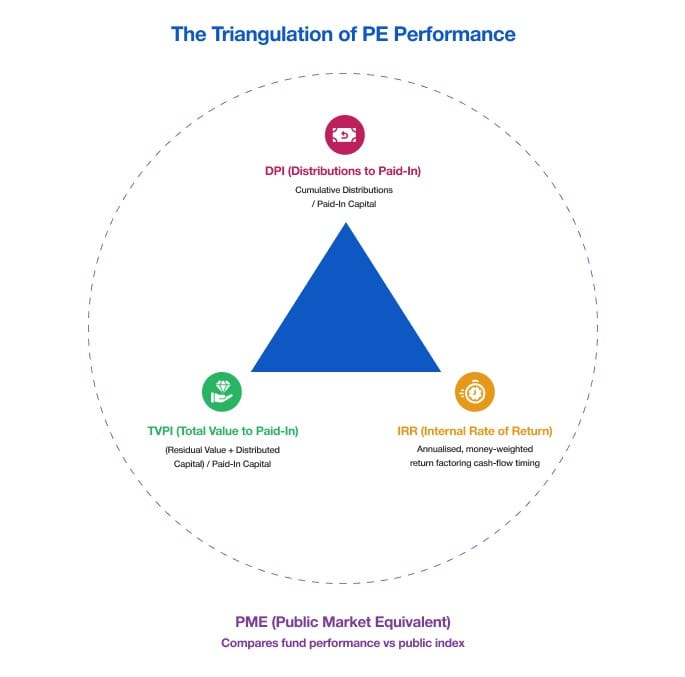
- DPI measures the cash that has actually been returned to LPs.
- TVPI includes DPI plus any unrealized value, showing the total potential value of the portfolio if sold today.
- IRR reflects how the timing of cash flows affects overall returns, crucial for assessing the true performance of a fund over time.
Combining these metrics enables LPs to assess liquidity along with the scale, pace and future return potential of a fund. Additionally, PME compares private equity performance against public market indices (e.g., Nifty), allowing LPs to evaluate whether a fund truly outperforms broader market benchmarks.
The Lifecycle Context Matters: How DPI Evolves Over Time
DPI changes depending on where a fund is in its lifecycle:
- Early Years (1-3 years): Capital is still being deployed and exits are rare. DPI is low, but this is part of the natural J-curve. It doesn’t indicate underperformance.
- Mid-Life (4-7 years): Companies begin scaling and exits start. DPI rises, but it hasn't yet peaked.
- Later Years (8-12+ years): DPI dominates as paper gains are realized into actual cash and unrealized value decreases.
This lifecycle pattern varies depending on the fund strategy. Buyout funds typically experience quicker DPI growth due to investments in mature companies, whereas venture and growth funds see a slower rise, which sharpens in later years.
How fund managers take control on GP’s influence on DPI
Fund managers understand that strong DPI is critical when raising new funds. In slower exit markets, many managers turn to GP-led secondaries, including continuation funds, to create liquidity while holding onto valuable assets. These continuation funds can provide flexibility, but they often raise questions about pricing, rollovers and conflicts of interest.
In 2024, the global secondary market hit US$152B, with GP-led deals making up nearly half of that. In India, continuation vehicles accounted for about 21% of emerging market activity. While they can offer flexibility, for LPs, the difference between organic exits (such as IPOs or trade sales) and engineered exits (like continuation funds) is critical. Organic exits reflect true market demand while continuation funds, although flexible, can muddy the waters.
What leading Indian LPs track: The shift from DPI to broader metrics
Leading LPs in India are moving beyond DPI. Their dashboards now track:
- Cash flow by vintage to manage liquidity risk.
- PME to account for any illiquidity premium.
- TVPI-to-DPI conversion to measure fund efficiency.
- NAV stress tests against public comps or secondary market prices.
- India-specific quartile benchmarks like those from Preqin–IVCA.
A comprehensive approach to fund performance
DPI remains an essential metric, but it must be understood within the broader context of TVPI, IRR, PME and lifecycle considerations. Combining these metrics allows LPs to gain a clearer and more accurate picture of a fund’s performance and its potential for future success.
At Taghash, we bring all these insights under one roof, turning performance data into clarity. This enables LPs, funds and ecosystem players to make smarter and more informed allocation decisions. Click here to book a demo.